Table of Contents
This document describes two functional modules of the CUBA platform, which display charts and geographic maps respectively. These subsystems are implemented in the same base project – charts – and thus can only be included in an application project together.
Charts and map display functionality is currently available only for the web client.
This manual is intended for developers building applications using CUBA platform. It is assumed that the reader is familiar with the Developer's Manual, which is available at www.cuba-platform.com/manual.
This guide, as well as any other documentation on CUBA platform, is available at www.cuba-platform.com/manual.
CUBA charts display subsystem implementation is based on AmCharts library, therefore familiarity with this library may be beneficial. See www.amcharts.com.
If you have any feedback or would like to suggest an improvement for this manual, please contact support at www.cuba-platform.com/support/topics.
If you find an error in this document, please specify the section number and attach a small piece of surrounding text to help us find it.
CUBA platform charts display subsystem supports various chart types: pie charts, line plots, bubble charts, radar charts, funnel charts and more. It is also possible to export charts. Most chart types support zoom and scrolling. At the moment of writing, the chart display subsystem supports only the Web Client for Vaadin7.
AmCharts library which is the basis of the chart display subsystem is distributed under a license, which allows its free use if you keep the link to the library website. Alternatively, you can purchase an AmCharts license for your project and remove the link.
Charts are displayed using the Chart component acting as a universal canvas. Chart type is
defined by the configuration property, which has the AbstractChart type.
Charts can be described in a screen XML-descriptor. To do this, you should connect the corresponding
namespace:
<window xmlns="http://schemas.haulmont.com/cuba/window.xsd"
        xmlns:chart="http://schemas.haulmont.com/charts/charts.xsd"
        ...>
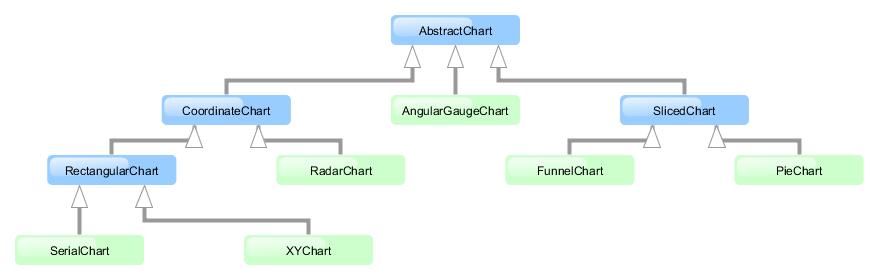
XML elements corresponding to different chart types:
-
chart:xyChart- XYChart -
chart:serialChart- SerialChart -
chart:pieChart- PieChart -
chart:funnelChart- FunnelChart -
chart:gaugeChart- AngularGaugeChart -
chart:radarChart- RadarChart
Each chart type has its own set of attributes and methods, which replicate the functionality of the corresponding charts from AmCharts library. Documentation on the properties and methods of the charts is available at docs.amcharts.com/3/javascriptcharts.
Any configuration attribute can be set to null; in this case the system will use the default value (except the cases specified in the AmCharts documentation).
There are two ways how you can pass data to a chart: through the DataProvider interface or using the datasource mechanism.
-
The
DataProviderinterface has a standard implementation:ListDataProviderclass. It contains a list ofDataIteminstances, each one containing a set of key-value pairs. An instance ofDataProvideris passed to thesetDataProvider()method of chart configuration. This approach to providing chart data is the most universal, but it requires you to create instances ofDataProviderandDataItemin a screen controller. -
A
CollectionDatasourcetype datasource can be assigned to aChartcomponent by invoking thesetDatasource()method. This approach requires an entity that will represent chart data. It may be convenient when such entity already exists in the application data model and also when chart data should be displayed as a table.
Section 1.4, “Example of Working with Charts” illustrates both approaches to providing chart data.
Entity properties or the values contained in an instance of DataProvider which are used for display purposes are defined in the chart attributes. The set of chart attributes may differ for different chart types. For example, for the chart:pieChart component, you should define the valueField and titleField
attributes. The following types are allowed for attribute values: Integer, Long, Double, String, Boolean, Date.
Dynamic addition of data to an existing chart is not supported; you should redraw the entire chart to display new data. This can be done using the repaint() method.
It is possible to configure handling of different event types. The following listener types are available:
-
AxisZoomListener- chart axis scaling. -
ChartClickListener- click on the canvas. -
RightClickListener- right click on the canvas. -
CursorPeriodSelectListener- selection of the display period with a cursor. -
CursorZoomListener- scaling of the chart area with a cursor. -
GraphClickListener- click on a graph. -
GraphItemClickListener- click on a graph item. -
LegendItemHideListener- hiding a legend item. -
LegendItemShowListener- showing a legend item. -
LegendItemClickListener- click on a legend item. -
SliceClickListener- click on a slice in a pie chart. -
SliceRightClickListener- right-click on a slice in a pie chart. -
SlicePullInListener- shift of a slice of a pie chart into the chart. -
SlicePullOutListener- shift of a slice of a pie chart out of the chart. -
ZoomListener- scaling of the canvas.
Event handling examples are available in Section 1.4.4, “Using Events”.
This chapter shows how you can use the chart display subsystem using the sample Library application which can be downloaded by means of CUBA Studio.
-
Run CUBA Studio, go to window and download the Library project.
-
Open the Library project in Studio.
-
Open -> and include the charts project into the list of Base projects; save changes. Confirm when Studio will suggest recreating Gradle scripts.
-
Select -> . At this point, the application will be assembled and deployed to the Tomcat application server located at
build/tomcat. -
Create the application database by selecting -> .
-
Select -> to create project files for IntelliJ IDEA.
Once the steps above are complete, the chart display functionality will be connected to the application and ready to be used.
In this section, we shall create a service allowing us to extract data for the chart from the database.
-
One of the methods of the service will return a list of non-persistent entities, therefore let us start by creating and registering a class for this entity.
Create the
com.sample.library.entityclass in the globalBooksByGenrepackage of the global module:package com.sample.library.entity; import com.haulmont.chile.core.annotations.MetaClass; import com.haulmont.chile.core.annotations.MetaProperty; import com.haulmont.cuba.core.entity.AbstractNotPersistentEntity; @MetaClass(name = "library$BooksByGenre") public class BooksByGenre extends AbstractNotPersistentEntity { @MetaProperty private String genre; @MetaProperty private Long countOfBooks; public String getGenre() { return genre; } public void setGenre(String genre) { this.genre = genre; } public Long getCountOfBooks() { return countOfBooks; } public void setCountOfBooks(Long countOfBooks) { this.countOfBooks = countOfBooks; } }An instance of this class contains the number of books of a certain genre. Then, we should register the entity class in the
metadata.xmlfile of the global module:<metadata-model root-package="com.sample.library"> <class>com.sample.library.entity.BooksByGenre</class> </metadata-model> -
An interface and a service class can be created using CUBA Studio. For this, open the Services tab of the navigation panel and click . In a window that opens, fill in the Interface field with the following value:
com.sample.library.service.StatisticsService. Bean and Service name fields will be updated with suitable values ofcom.sample.library.service.StatisticsServiceBeanandlibrary_StatisticsServicerespectively. Save changes.Open the interface of the
StatisticsServiceservice in IDE and declare the methods retrieving data from the database:package com.sample.library.service; import com.sample.library.entity.BooksByGenre; import java.util.List; import java.util.Map; public interface StatisticsService { String NAME = "library_StatisticsService"; public List<BooksByGenre> getCountOfBooksByGenre(); public List<String> getTopPublishers(int count); public Map<Integer, Map<String, Long>> getCountOfBooksByPublisherAndYear(); } -
Then, open the
StatisticsServiceBeanservice class and replace its content with the following code:package com.sample.library.service; import com.google.common.collect.Lists; import com.haulmont.cuba.core.EntityManager; import com.haulmont.cuba.core.Persistence; import com.haulmont.cuba.core.Transaction; import com.sample.library.entity.BooksByGenre; import org.springframework.stereotype.Service; import javax.inject.Inject; import java.util.ArrayList; import java.util.LinkedHashMap; import java.util.List; import java.util.Map; @Service(StatisticsService.NAME) public class StatisticsServiceBean implements StatisticsService { @Inject private Persistence persistence; @Override public List<BooksByGenre> getCountOfBooksByGenre() { List<BooksByGenre> result = new ArrayList<>(); String query = "select ltype.name, count(book) " + "from library$Book book join book.literatureType ltype " + "group by ltype.name order by ltype.name"; Transaction transaction = persistence.createTransaction(); try { EntityManager em = persistence.getEntityManager(); List<Object[]> resultList = em.createQuery(query, Object[].class).getResultList(); for (Object[] row : resultList) { BooksByGenre entity = new BooksByGenre(); entity.setGenre((String) row[0]); entity.setCountOfBooks((Long) row[1]); result.add(entity); } } finally { transaction.end(); } return result; } @Override public List<String> getTopPublishers(final int count) { List<String> result = Lists.newArrayList(); String query = "select instance.bookPublication.publisher.name, count(instance) " + "from library$BookInstance instance " + "group by instance.bookPublication.publisher.name order by count(instance) desc"; Transaction transaction = persistence.createTransaction(); try { EntityManager em = persistence.getEntityManager(); List resultList = em.createQuery(query).getResultList(); for (int i = 0; i < resultList.size(); i++) { if (i == count) { break; } Object[] data = (Object[]) resultList.get(i); result.add((String) data[0]); } } finally { transaction.end(); } return result; } @Override public Map<Integer, Map<String, Long>> getCountOfBooksByPublisherAndYear() { Map<Integer, Map<String, Long>> result = new LinkedHashMap<>(); String query = "select instance.bookPublication.publisher.name, instance.bookPublication.year, count(instance) " + "from library$BookInstance instance " + "group by instance.bookPublication.year, instance.bookPublication.publisher.name " + "order by instance.bookPublication.year, instance.bookPublication.publisher.name"; Transaction transaction = persistence.createTransaction(); try { EntityManager em = persistence.getEntityManager(); List resultList = em.createQuery(query).getResultList(); for (Object row : resultList) { Object[] data = (Object[]) row; String publisher = (String) data[0]; Integer year = (Integer) data[1]; Long quantity = (Long) data[2]; if (result.get(year) == null) { result.put(year, new LinkedHashMap<String, Long>()); } result.get(year).put(publisher, quantity); } } finally { transaction.end(); } return result; } }The
getCountOfBooksByGenre()method returns the number of books of every genre as a list ofBooksByGenreentities. ThegetTopPublishers(int count)method sorts publishers by the number of issued books available in the library in descending order, and returns the firstcountof publishers. ThegetCountOfBooksByPublisherAndYear()method returns the number of books issued by publishers in a given year.
Open the Screens tab in CUBA Studio and create a screen in the web module. Enter the value com/sample/library/web/charts/statistics.xml in the Reference field. The fields - Id, Controller Name and Messages Pack will be filled in with appropriate values. Save changes. Open the XML tab and replace its content with the following code:
<?xml version="1.0" encoding="UTF-8" standalone="no"?>
<window xmlns="http://schemas.haulmont.com/cuba/window.xsd"
        caption="msg://statistic"
        class="com.sample.library.web.charts.statistics.Statistics"
        messagesPack="com.sample.library.web.charts.statistics"
        xmlns:chart="http://schemas.haulmont.com/charts/charts.xsd">
    <dsContext>
        <collectionDatasource id="pieDs"
                              class="com.sample.library.entity.BooksByGenre"
                              refreshMode="NEVER"
                              view="_local"/>
    </dsContext>
    <layout spacing="true">
        <tabSheet height="100%"
                  width="100%">
            <tab id="pieChartTab"
                 caption="msg://booksByGenres">
                <hbox expand="pieChart"
                      height="100%"
                      margin="true"
                      spacing="true"
                      width="100%">
                    <chart:pieChart id="pieChart"
                                    angle="30"
                                    balloonText="[[genre]] - [[percents]]%"
                                    datasource="pieDs"
                                    depth3D="15"
                                    height="100%"
                                    titleField="genre"
                                    valueField="countOfBooks"
                                    width="100%">
                        <chart:exportConfig menuTop="0px">
                            <chart:menuItems>
                                <chart:menu format="PNG"
                                            icon="VAADIN/resources/amcharts/images/export.png"/>
                            </chart:menuItems>
                        </chart:exportConfig>
                    </chart:pieChart>
                    <table columnControlVisible="false"
                           height="100%"
                           width="300px">
                        <columns>
                            <column id="genre"/>
                            <column id="countOfBooks"/>
                        </columns>
                        <rows datasource="pieDs"/>
                    </table>
                </hbox>
            </tab>
            <tab id="stackedChartTab"
                 caption="msg://countOfBooksByPublisherAndYear"
                 spacing="true">
                <chart:serialChart id="stackedChart"
                                   categoryField="year"
                                   height="100%"
                                   plotAreaFillAlphas="0.1"
                                   width="100%">
                    <chart:chartCursor/>
                    <chart:legend markerType="TRIANGLE_RIGHT"
                                  position="TOP"
                                  valueAlign="LEFT"/>
                    <chart:categoryAxis startOnAxis="true"
                                        title="msg://year"/>
                    <chart:valueAxes>
                        <chart:axis gridAlpha="0.07"
                                    position="LEFT"
                                    stackType="REGULAR"
                                    title="msg://countOfBooks"/>
                    </chart:valueAxes>
                    <chart:exportConfig menuTop="0px">
                        <chart:menuItems>
                            <chart:menu format="PNG"
                                        icon="VAADIN/resources/amcharts/images/export.png"/>
                        </chart:menuItems>
                    </chart:exportConfig>
                </chart:serialChart>
            </tab>
        </tabSheet>
    </layout>
</window>
The root element of the screen descriptor contains a new xmlns:chart attribute:
<window xmlns:chart="http://schemas.haulmont.com/charts/charts.xsd"
    ...
    >
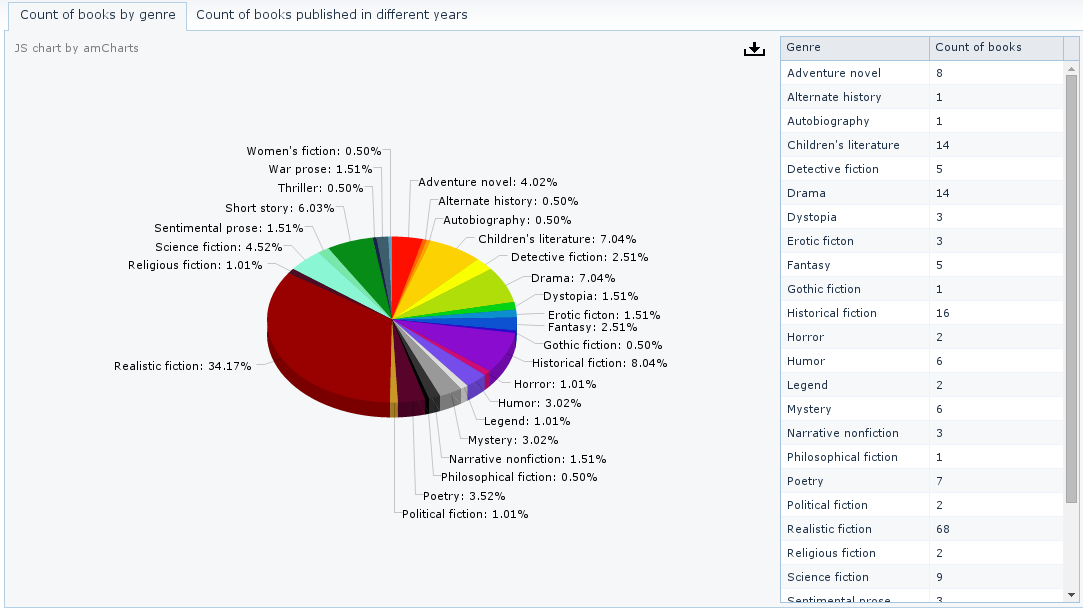
The screen that we created contains a panel with two tabs. The first tab contains a pie chart showing the distribution of books by genre:
<chart:pieChart id="pieChart"
                    angle="30"
                    balloonText="[[genre]] - [[percents]]%"
                    datasource="pieDs"
                    depth3D="15"
                    height="100%"
                    titleField="genre"
                    valueField="countOfBooks"
                    width="100%">
        <chart:exportConfig menuTop="0px">
            <chart:menuItems>
                <chart:menu format="PNG"
                            icon="VAADIN/resources/amcharts/images/export.png"/>
            </chart:menuItems>
        </chart:exportConfig>
    </chart:pieChart>
The chart retrieves data from the pieDs datasource defined in the datasource attribute. Names and values are displayed using the genre and countOfBooks attributes of the BooksByGenre entity; the list of instances for this entity is stored in the datasource. The datasource is also connected to a table that shows the same data as the chart.
The pieChart component contains the following attributes:
-
angle- defines the chart angle. May have a value from0to90. -
balloonText- defines text for the tooltip that appears when hovering over a pie slice. You can use the following tags:[[value]],[[title]],[[persents]],[[description]], as well as keys from theDataItemlisted in aDataProviderinstance, or names of the entity attributes from the datasource. -
depth3D- chart thickness. When used in combination with theangleattribute, helps to create a 3D effect. -
titleField- a key from the list of pairs contained in theDataItemobjects listed in aDataProviderinstance; this key is used to determine the name of a pie chart slice. -
valueField- a key from the list of pairs contained in theDataItemobjects listed in aDataProviderinstance; this key is used to determine the value of a pie chart slice.
The pieChart component contains the following elements:
-
chart:legend- defines chart legend. Thepositionattribute defines the location of the legend relative to the chart, andmarkerTypedefines the shape of the information marker for pie chart slices. -
chart:exportConfig– enables chart export. ThemenuTop,menuLeft,menuRightandmenuBottomattributes define the button location. In our example, the button is located in the top right corner of the chart.The
chart:menuItemselement contains export settings. In addition to thepngformat used in our example, the chart can also be exported asjpg,svgorpdf. Theiconattribute contains a path to an image that should be used as an icon for the export button.
The second tab contains a chart showing the number of books issued by several publishers in different years:
<chart:serialChart id="stackedChart"
                       categoryField="year"
                       height="100%"
                       width="100%">
       <chart:chartCursor/>
       <chart:legend markerType="TRIANGLE_RIGHT"
                     position="TOP"
                     valueAlign="LEFT"/>
       <chart:categoryAxis startOnAxis="true"
                           title="msg://year"/>
       <chart:valueAxes>
          <chart:axis position="LEFT"
                      stackType="REGULAR"
                      title="msg://countOfBooks"/>
       </chart:valueAxes>
       <chart:exportConfig menuTop="0px">
          <chart:menuItems>
             <chart:menu format="PNG"
                         icon="VAADIN/resources/amcharts/images/export.png"/>
          </chart:menuItems>
       </chart:exportConfig>
    </chart:serialChart>
This chart retrieves data through the DataProvider created in the controller (see below), so the datasource attribute is not defined.
chart:serialChart attributes:
-
categoryField- a key from the set of pairs contained in theDataItemobjects listed in aDataProviderinstance; this key is used to determine the labels for the category axis.
The elements of chart:serialChart:
-
chart:chartCursor- an optional element adding a cursor to the chart; the cursor follows the mouse pointer and shows a tooltip with the value of the corresponding point on a chart. -
chart:categoryAxis- an element that describes the category axis. SettingstartOnAxisto true causes drawing the chart right from the value axis. The default value for this attribute isfalse. In this case, there will be a small gap between the value axis and the chart. Thetitleattribute defines the title of the value axis. -
chart:valueAxes- an element that defines vertical value axes. In our case, only one vertical axis is used; the axis is described by thechart:axiselement. Thepositionattribute defines position of the value axis relative to the chart. SettingstackTypetoREGULARmakes the chart display a rolling value. Setting this attribute tononerefers to a non-rolling value.
Open the Controller tab and replace its content with the following code:
package com.sample.library.web.charts.statistics;

import com.haulmont.charts.gui.amcharts.model.Graph;
import com.haulmont.charts.gui.amcharts.model.GraphType;
import com.haulmont.charts.gui.amcharts.model.charts.SerialChart;
import com.haulmont.charts.gui.amcharts.model.data.ListDataProvider;
import com.haulmont.charts.gui.amcharts.model.data.MapDataItem;
import com.haulmont.charts.gui.components.charts.Chart;
import com.haulmont.cuba.gui.components.AbstractWindow;
import com.haulmont.cuba.gui.data.CollectionDatasource;
import com.sample.library.entity.BooksByGenre;
import com.sample.library.service.StatisticsService;

import javax.inject.Inject;
import java.util.List;
import java.util.Map;
import java.util.UUID;

public class Statistics extends AbstractWindow {

    @Inject
    private CollectionDatasource<BooksByGenre, UUID> pieDs;

    @Inject
    private Chart stackedChart;

    @Inject
    private StatisticsService statisticsService;

    public void init(Map<String, Object> param) {
        initPieChart();
        initStackedChart();
    }

    private void initPieChart() {
        pieDs.refresh();

        List<BooksByGenre> booksByGenreList = statisticsService.getCountOfBooksByGenre();
        for (BooksByGenre booksByGenre : booksByGenreList) {
            pieDs.includeItem(booksByGenre);
        }
    }

    private void initStackedChart() {
        List<String> allPublishers = statisticsService.getTopPublishers(5);
        Map<Integer, Map<String, Long>> structuredData = statisticsService.getCountOfBooksByPublisherAndYear();

        ListDataProvider dataProvider = new ListDataProvider();

        for (Map.Entry<Integer, Map<String, Long>> entry : structuredData.entrySet()) {
            MapDataItem mapDataItem = new MapDataItem().add("year", entry.getKey());

            for (String publisher : allPublishers) {
                if (entry.getValue().containsKey(publisher)) {
                    mapDataItem.add(publisher, entry.getValue().get(publisher));
                } else {
                    mapDataItem.add(publisher, 0);
                }
            }
            dataProvider.addItem(mapDataItem);
        }

        SerialChart stackedChartConfiguration = (SerialChart) stackedChart.getConfiguration();
        stackedChartConfiguration.setDataProvider(dataProvider);

        Graph[] graphs = new Graph[allPublishers.size()];
        int i = 0;
        for (String publisher : allPublishers) {
            Graph publisherGraph = new Graph();
            publisherGraph.setFillAlphas(0.6);
            publisherGraph.setLineAlpha(0.4);
            publisherGraph.setTitle(publisher);
            publisherGraph.setType(GraphType.LINE);
            publisherGraph.setValueField(publisher);
            publisherGraph.setBalloonText(publisher + " - [[year]] year: [[" + publisher + "]] books");

            graphs[i] = publisherGraph;
            i++;
        }
        stackedChartConfiguration.addGraphs(graphs);
    }
}
The initPieChart() method populates the pieDs datasource with the data retrieved from the service. The refresh() method initializes the datasource. This method should be invoked regardless of the refreshMode="NEVER" attribute declared in the XML-descriptor.
The initStackedChart(List<String> allPublishers) method submits data to the chart as a rolling value. This type of charts shows the ratio of separate parts to their total value. The method accepts a list of publishers who have published the largest number of books available in the library. For each publisher, a separate graph is rendered showing the number of books issued in different years. The graph corresponds to an instance of the Graph class. Let’s have a look at different graph configuration options:
-
setFillAlphas(0.6)- defines fill opacity. -
setLineAlpha(0.4)- defines graph line width. Possible values are from0to1. -
setTitle(publisher)- defines the graph title. -
setType(GraphType.LINE)- defines data display style. -
setValueField(publisher)- a key from the list of pairs contained in theDataItemobjects listed in aDataProviderinstance; this key is used to determine graph values. -
setBaloonText(publisher + " - [[year]] year: [[" + publisher + "]] books")- defines tooltip content.
Below are the screenshots of the screen that we have just created. Add the screen to the menu, then rebuild the project using -> and log in to the system. Open the statistics screen.
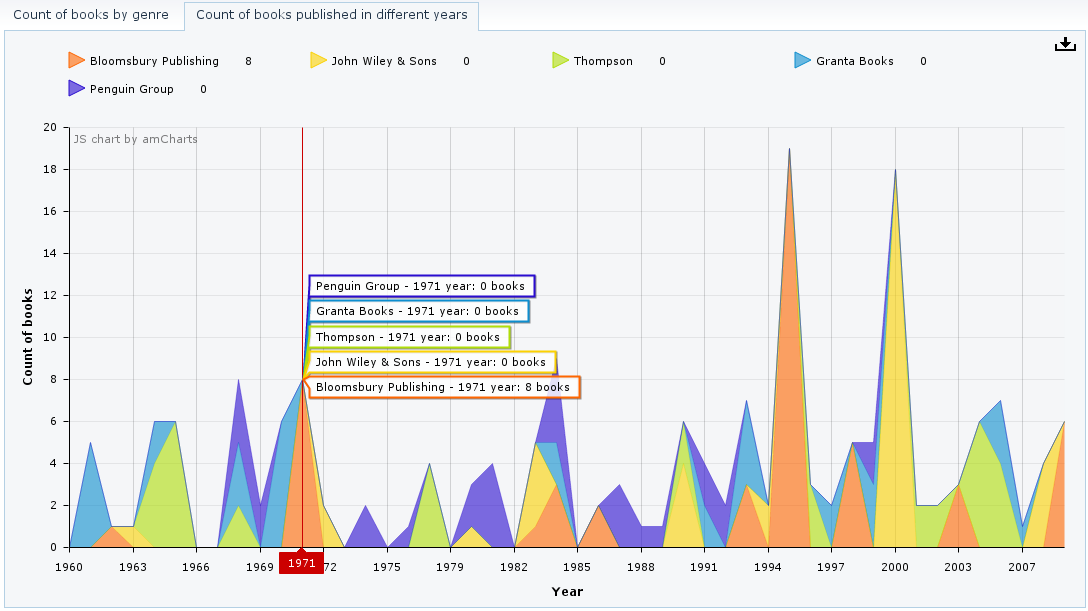
The rolling chart illustrates the cursor showing detailed information on the number of books issued by the publishers during the selected year.
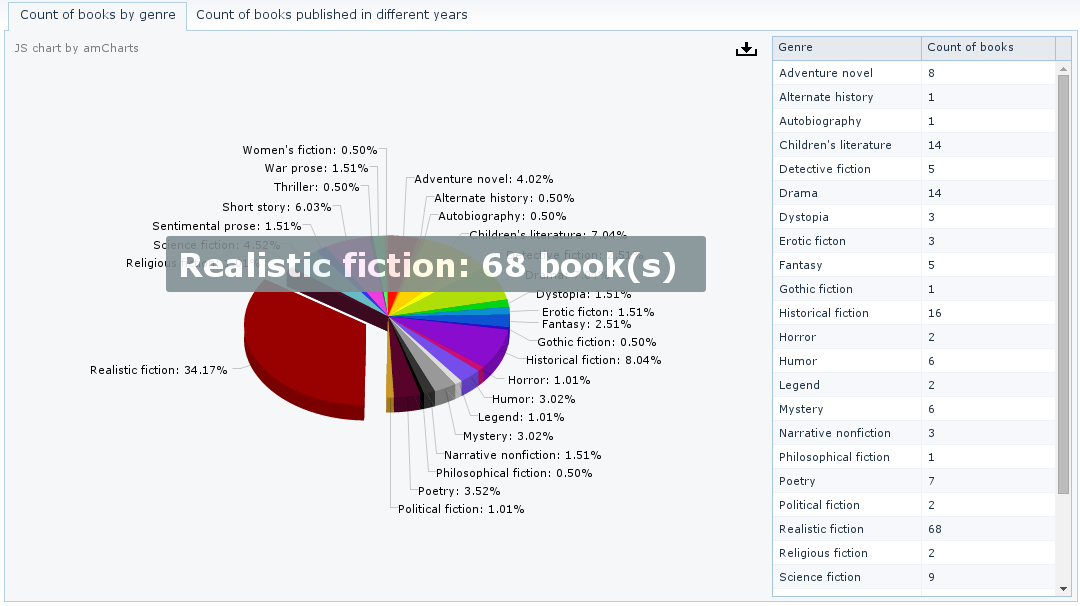
Let us consider the use of events. We will add handling of a slice shift out to the screen created in Section 1.4.3, “Creating Charts”. Open the screen XML descriptor in the IDE and inject the chart:
@Inject
    private Chart pieChart;
Then add a listener in the initPieChart() method:
pieChart.addSlicePullOutListener(new Chart.SlicePullOutListener() {
    @Override
    public void onPullOut(Chart.SlicePullOutEvent event) {
        BooksByGenre booksByGenre = (BooksByGenre) event.getItem();
        String msg = booksByGenre.getGenre() + ": " + booksByGenre.getCountOfBooks() + " book(s)";
        showNotification(msg, NotificationType.HUMANIZED);
    }
});
To see the results, rebuild the project using -> and log in to the system. Open the screen and click one of the pie slices to shift it out.
CUBA platform map display subsystem is based on integration with a third-party map service provider. Currently, only Google Maps service is supported.
-
Response to events:
-
Mouse click.
-
Map pan and zoom.
-
Marker click and drag.
-
Close pop-up window.
-
-
Adding markers. Marker may be either fixed or draggable by user. Markers can process mouse clicks and send corresponding events to the screen code.

-
Displaying polylines and polygons.

-
Drawing polygons.
-
Heat map rendering.
In order to display maps in your application, you should include the charts base project, as it was described for the chart display subsystem. Additionally, you should define the following application properties for the Web Client block:
-
Mandatory parameter – map service API access key. For a free key use the
cuba.charts.map.freeApiKeyproperty. For a commercial license, the following properties should be defined:-
cuba.charts.map.useBusinessApiKey = true- commercial key flag. -
cuba.charts.map.businessApiKey- API key. -
cuba.charts.map.clientId- client identifier, may be mandatory depending on the map service provider. Mandatory for Google Maps.
-
-
Optional parameters:
-
cuba.charts.map.defaultZoom- default zoom level for the map. -
cuba.charts.map.defaultLatitude- default latitude of the map center point. -
cuba.charts.map.defaultLongitude- default longitude of the map center point. -
cuba.charts.map.provider- map service provider,googleby default.
-
Example of a web-app.properties file:
cuba.charts.map.freeApiKey = my_key
cuba.charts.map.defaultZoom = 13.0
cuba.charts.map.defaultLatitude = 51.5001
cuba.charts.map.defaultLongitude = -0.1262
You can display maps in your application screens using the com.haulmont.charts.gui.components.map.MapViewer component.
To add the component, declare the chart namespace in the root element of the screen XML descriptor:
<window xmlns="http://schemas.haulmont.com/cuba/window.xsd"
        xmlns:chart="http://schemas.haulmont.com/charts/charts.xsd"
        ...>
XML-name of the component: mapViewer. Component declaration example:
<layout>
    <vbox id="mapBox" height="100%">
        <chart:mapViewer id="map" width="100%" height="100%"/>
    </vbox>
</layout>
You can define the following component parameters in the screen XML-descriptor:
-
id,width,height- standard component properties. -
mapType- map type corresponding to theMapViewer.Type:roadmap,satellite,hybrid,terrain. Default isroadmap. -
vendor- map service provider. Currently the only supported value isgoogle.
Main configuration of the map and its components is performed in a screen controller. For this, you only need to inject the component declared in the XML-descriptor:
@Inject
private MapViewer map;

@Override
public void init(Map<String, Object> params) {
    GeoPoint center = map.createGeoPoint(53.490905, -2.249558);
    map.setCenter(center);
}
-
Map configuration methods:
-
setZoom()- sets the map zoom level. -
setCenter()- sets the map center point. -
setVisibleAreaBoundLimitsEnabled()- enables visible area limitation mode. -
setVisibleAreaBoundLimits()- sets boundaries of the visible area of the map. -
fitToBounds()- sets the minimum map zoom as the one which will be sufficient to show in full an area limited by north-eastern and south-western coordinates. -
setMaxZoom()- sets the maximum available zoom level. -
setMinZoom()- sets the minimum available zoom level. -
setDraggable()- enables/disables map dragging mode. -
setKeyboardShortcutsEnabled()- enables/disables keyboard shortcuts. -
setScrollWheelEnabled()- enables/disables map zoom with a mouse scroll wheel. -
setMapType()- defines map type.
-
-
Map component interfaces (can be found in
com.haulmont.charts.gui.map.modelpackage):-
GeoPoint- an auxiliary component, which is not displayed on the map. This component can be used to set such map parameters as the center point, boundaries, or to create more complex map components. The object can be created using thecreateGeoPoint()method of theMapViewerinterface. For example:GeoPoint center = map.createGeoPoint(53.490905, -2.249558); map.setCenter(center);
-
Marker- a component that marks a location on the map. By default, a standard icon of the map service vendor is used. You can use thecreateMarker()andaddMarker()methods of theMapViewerinterface to create this object and put it on a map. For example:Marker marker = map.createMarker("My place", map.createGeoPoint(53.590905, -2.249558), true); marker.setClickable(true); map.addMarker(marker); -
Polyline- a component that displays a polyline. You can use thecreatePolyline()andaddPolyline()methods of theMapViewerinterface to create this object and put it on a map. For example:List<GeoPoint> coordinates = new ArrayList<>(); coordinates.add(map.createGeoPoint(53.49, -2.54)); coordinates.add(map.createGeoPoint(53.49, -2.22)); coordinates.add(map.createGeoPoint(53.89, -2.22)); coordinates.add(map.createGeoPoint(53.99, -2.94)); Polyline polyline = map.createPolyline(coordinates); map.addPolyline(polyline);
-
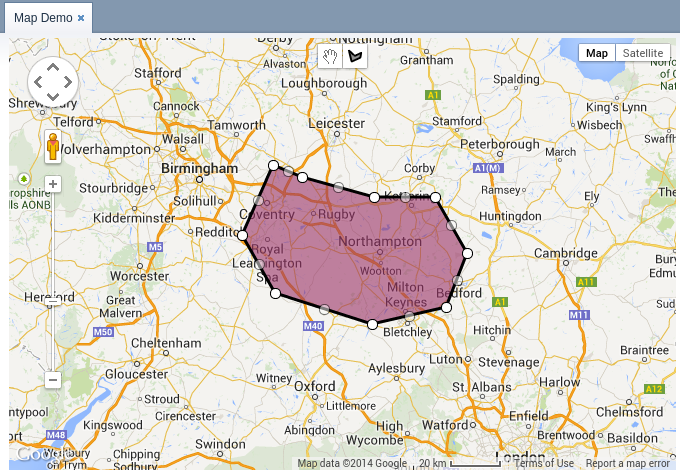
Polygon- a component that displays a polygon. You can use thecreatePolygon()andaddPolygonOverlay()methods of theMapViewerinterface to create this object and put it on a map. For example:List<GeoPoint> coordinates = new ArrayList<>(); coordinates.add(map.createGeoPoint(53.49, -2.54)); coordinates.add(map.createGeoPoint(53.49, -2.22)); coordinates.add(map.createGeoPoint(53.89, -2.22)); coordinates.add(map.createGeoPoint(53.99, -2.94)); Polygon p = map.createPolygon(coordinates, "#9CFBA9", 0.6, "#2CA860", 1.0, 2); map.addPolygonOverlay(p);
-
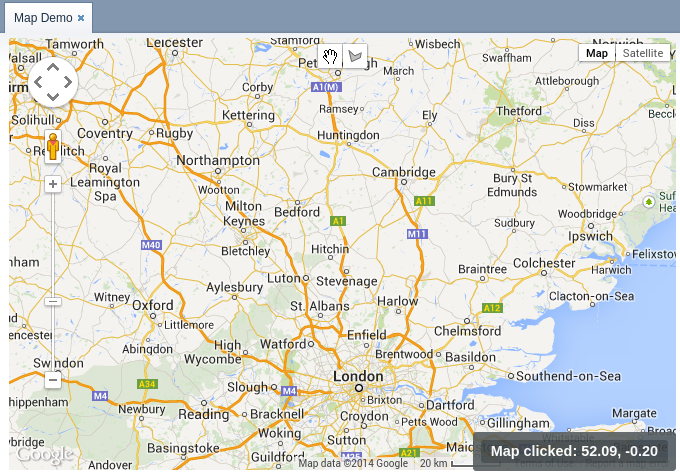
InfoWindow- a map component that displays information in a pop-up window. You can use thecreateInfoWindow()andopenInfoWindow()methods of theMapViewerinterface to create this object and put it on a map. For example:InfoWindow w = map.createInfoWindow("Some text"); map.openInfoWindow(w);Information window can be tied to a marker, for example:
map.addMarkerClickListener(new MarkerClickListener() { @Override public void onClick(MarkerClickEvent event) { Marker marker = event.getMarker(); String caption = String.format("Marker clicked: %.2f, %.2f", marker.getPosition().getLatitude(), marker.getPosition().getLongitude()); InfoWindow w = map.createInfoWindow(caption, marker); map.openInfoWindow(w); } }); -
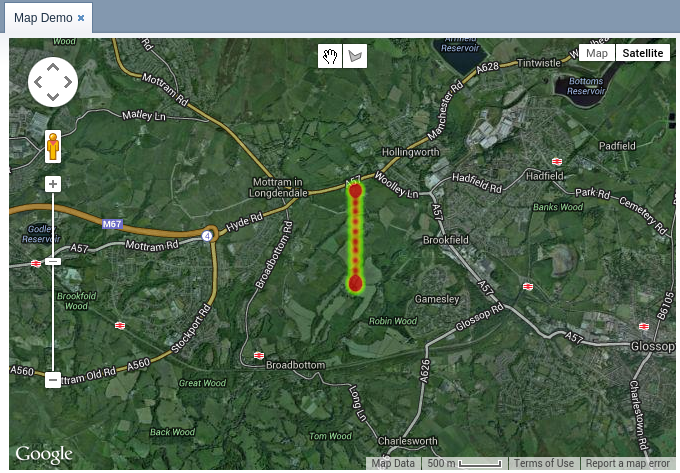
HeatMapLayer- a map layer showing a heat map intended to display data density distribution across different geopoints. Data density is highlighted with color. By default, regions with higher points density are displayed in red and regions with lower density – in green. You can use thecreateHeatMapLayer()andaddHeatMapLayer()methods of theMapViewerinterface to create this object and put it on a map. For example:HeatMapLayer heatMapLayer = map.createHeatMapLayer(); List<GeoPoint> data = new ArrayList<>(); data.add(map.createGeoPoint(53.450, -2.00)); data.add(map.createGeoPoint(53.451, -2.00)); data.add(map.createGeoPoint(53.452, -2.00)); data.add(map.createGeoPoint(53.453, -2.00)); data.add(map.createGeoPoint(53.454, -2.00)); heatMapLayer.setData(data); map.addHeatMapLayer(heatMapLayer);
The data used for the heat map layer can be changed using a separate
setData()method. This change does not require re-adding the layer to the map. -
DrawingOptions- auxiliary drawing component. Only polygon drawing is currently supported. Drawing mode can be enabled by passing an instance ofDrawingOptionsto theMapViewer. Example:DrawingOptions options = new DrawingOptions(); PolygonOptions polygonOptions = new PolygonOptions(true, true, "#993366", 0.6); ControlOptions controlOptions = new ControlOptions( Position.TOP_CENTER, Arrays.asList(OverlayType.POLYGON)); options.setEnableDrawingControl(true); options.setPolygonOptions(polygonOptions); options.setDrawingControlOptions(controlOptions); options.setInitialDrawingMode(OverlayType.POLYGON); map.setDrawingOptions(options);
-
-
Event listeners (located in the
com.haulmont.charts.gui.map.model.listeners) package):-
MapMoveListener- user drags a map with a mouse button pressed. -
MapClickListener- user clicks on a map. -
MarkerClickListener- user clicks on a marker. -
MarkerDragListener- user drags a marker. -
InfoWindowClosedListener- user closes an information window. -
PolygonCompleteListener- user creates a polygon in map editing mode. -
PolygonEditListener- user edits a polygon (moves or adds a vertex to an existing polygon). -
MapInitListener- map initialization complete. This listener is invoked once after the first load of the map when all the tiles are loaded and coordinates are available.
-
For a more detailed information about the methods and parameters of map components, please refer to the corresponding JavaDocs.