Creating a report in the system involves two dependent elements: visual presentation template and description of the data extracted for the report. The template is created in XLS(X), DOC(X), ODT, HTML formats using external tools, and the description of report data is created in the report designer screen.
Depending on the template and report parameters, the generated report can be in PDF, XLS(X), DOC(X) or HTML.
The report data structure can either be described in the report designer by creating bands, queries and other elements, or programmed in a Java class that implements a special interface. The report can take parameters from the user or from the calling code. You can specify users who will have access to the report, and system screens where it should appear.
The main components of the report generator are shown in the following diagram:
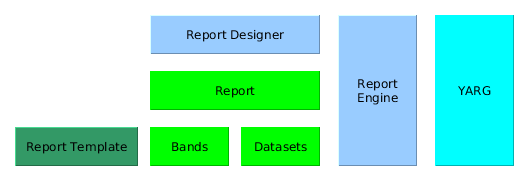
- YARG - framework, which is the core of the report generator.
- Report Engine integrates YARG into CUBA platform and provides additional functionality such as access rights to reports and integration with screens.
- Report Designer is a tool for describing and storing reports. It includes the infrastructure for storing report descriptions and templates, as well as screens to create and manage reports.
- Report - report data structure descriptor, including Bands (report bands) and Datasets (datasets which are being output in the bands).
- Report Template - report visual presentation template.
The Report structure tab of the report editor is described below:
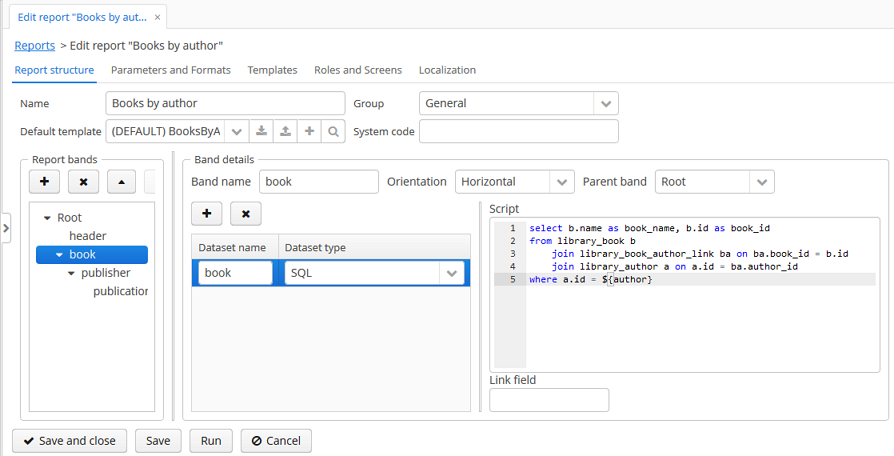
The top part contains fields to enter general report properties:
- Name - report name. The name can be localized in the Localization tab.
- Group - report group, which is used for grouping in the standard report browser.
- Default template - report output template.
- System code - optional code, which you may use to identify the report in the application code.
The main element of the report data structure is the band hierarchy - Report bands.
A report band has the following parameters:
- Band name - unique band name within the report. It must contain only Latin letters, numbers and underscores.
- Orientation - band orientation: Horizontal or Vertical. Horizontal bands are copied downwards, vertical - to the right. Horizontal bands may contain sub-bands.
- Parent band - parent band.
Each band includes one or more datasets. At the moment when a report is run, datasets are transformed into lists of rows, where each row contains a map of name-value pairs. A band appears in the report as many times as there are rows in its longest dataset. Field names are specified in the report template and are replaced with corresponding values from the dataset when the report is produced. When describing datasets, you can use external parameters of the report as well as fields from other bands - this allows creating linked bands.
Each report has the Root band. You can create datasets in it and refer to their fields from other bands, but you cannot use the Root band in the report template.
The Dataset name column value is used for user convenience only.
Supported dataset types are provided below:
-
SQL - the dataset is produced as result of SQL query execution. It is recommended to use aliases for query result fields with the help of the
asoperator. It is also recommended to enclose the aliases in double quotes to prevent possible case conversion by the DBMS:select u.name as "userName", u.login as "userLogin" from sec_user u
You can use report input parameters and parent bands fields in the query. Parameters should be addressed by name enclosed in
${}, for example${dateFrom}. Parent band fields should be addressed similarly, by adding the band name in front of the field name:${band1.field1}.Below is an example of an SQL query with a
groupIdparameter, obtained from thegroupparent band and an externalactiveparameter:select u.name as "userName", u.login as "userLogin" from sec_user u where u.group_id = ${group.groupId} and u.active = ${active} and u.delete_ts is nullYou should manually include conditions to filter soft deleted records for SQL queries.
-
JPQL - the dataset is produced as result of JPQL query execution. The resulted query fields must have aliases provided using the
asoperator. You can use report input parameters and parent bands fields in the JPQL query, similar to SQL query.Below is an example of a JPQL query with a
groupIdparameter, obtained from thegroupparent band and an externalactiveparameter:select u.name as userName, u.login as userLogin from sec$User u where u.group.id = ${group.groupId} and u.active = ${active}JPQL queries automatically support soft deletion and return only records which are not deleted.
-
Groovy - the dataset is produced as result of a Groovy script execution. The script must return an object of the
List<Map<String, Object>>type. Each element of this list - an object of theMap<String, Object>type - corresponds to one dataset record.The following objects are passed into the script:
-
params- external report parameters map. Below is an example to get a parameter value:def active = params['active']
-
parentBand- parent band as an object of thecom.haulmont.yarg.structure.BandDatatype. This object allows you to get a parent band field value by invoking thegetParameterValue()method, for example:def groupId = parentBand.getParameterValue('groupId') -
persistence- parent band as an object of thecom.haulmont.cuba.core.Persistencetype. You can use this object to get a parent band field value using theEntityManagermethod, for example:def tx = persistence.createTransaction() try { def em = persistence.getEntityManager() def query = em.createQuery('select g from sec$Group g') ... tx.commit() } finally { tx.end() } -
metadata- an object of thecom.haulmont.cuba.core.global.Metadatatype, providing access the application metadata. For example:def metaClass = metadata.getClassNN('sec$User') -
transactional- a method that takes a closure, which should be executed in a new transaction, as parameter. The currentEntityManagerbecomes the closure parameter. For example:transactional { em -> def query = em.createQuery('select g from sec$Group g') ... }You can use static methods of the
AppBeansclass to access any Spring beans of the middleware tier, for example:def dataWorker = com.haulmont.cuba.core.global.AppBeans.get('cuba_DataWorker')Below is an example of the Groovy script which extracts users by the group which is output in the parent band and by the
activeexternal parameter:def result = [] transactional { em -> def query = em.createQuery('select u from sec$User u where u.group.id = ?1 and u.active = ?2') query.setParameter(1, parentBand.getParameterValue('groupId')) query.setParameter(2, params['active']) query.resultList.each { user -> result.add(['userLogin': user.login, 'userName': user.name]) } } return result
-
-
Entity - the dataset consists of a single row and is produced using attributes of a single entity instance and the entities related to it.
The data source is produced from an external parameter of the Entity type, which must be described in the Parameters and Formats tab. The value in the Entity parameter name field must match the parameter alias.
The report template must contain fields with entity attribute names. Attributes used in the template should be listed in the special window, which is invoked by the Entity attributes button.
-
List of entities - the dataset is produced using a list of entity instances.
The data source is produced using an external parameter being a List of entities, which must be described in the Parameters and Formats tab. The value in the Entity parameter name field must match the parameter alias.
The report template must contain fields with entity attribute names. Attributes used in the template should be listed in the special window, which is invoked by the Entity attributes button.
You can create several templates for a single report in the Templates tab of the report editor. One of them must be selected as the default template in the Report structure tab.
Below is the form to add a template:
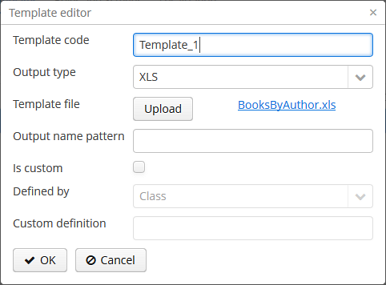
- Template code - template code for its identification.
- Output type - report output type. It should be consistent with the template file type according to the rules described in Chapter 1, Creating Reports.
- Template file - template file, which is loaded from the file system and saved to the database along with the report structure description.
- Output name pattern - optional file name pattern, which will be used for the produced report download.
- Defined with class - flag to use the template defined by a class.
- Custom class name - template class name used if the Defined with class flag is set.
You can create XLSX and XLS templates using Microsoft Office or OpenOffice / LibreOffice.
Each report band must have a corresponding region in the template, which is named as the band. To create named regions, select the desired cell ranges and enter the name in the field in the application top left corner. To edit existing named regions, use the Formulas → Name Manager menu command in Microsoft Office, and the Insert → Names → Manage command in OpenOffice.
The bands are output in the order specified in the report structure.
Horizontal bands may contain sub-bands. Therefore, for sub-bands, you need to create named regions directly under the regions that correspond to the parent bands.
The band dataset fields are placed in the template using strings having ${field_name} format, where field_name is the corresponding band field name. For example:
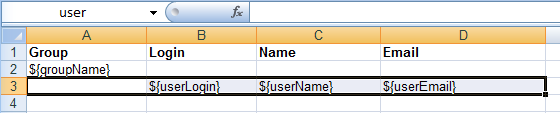
Cells may contain formatting as well as multiple fields inside. To output images or formulas, you need to place them entirely into the corresponding named region.
==== DOCX, DOC and ODT Templates
You can create an ODT template using OpenOffice / LibreOffice. In order to create DOC and DOCX templates, you can use OpenOffice or Microsoft Office.
A template of these types can include document text and optionally one or more tables. The document text outputs the data from the first rows of arbitrary bands. In a table, you can output an arbitrary number of band rows.
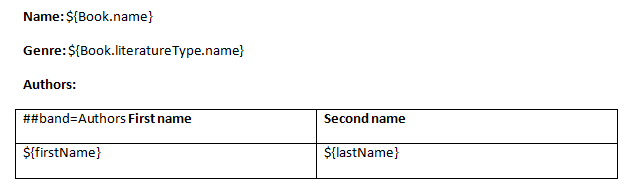
To place a field in the document text, you should use a string having ${band_name.field_name} format, where band_name is the band name, field_name - name of a band’s field.
In order to output data into a table, you should tie it to a band. This is done by specifying ##band=band_name in the table’s first cell, where band_name is the band name. The table fields are placed using ${field_name} format, where field_name is the field name of the band associated with the table. You can use band name prefix to access fields of other bands, same
as in the document text fields. You can output several fields in a single table cell.
The table must contain either one or two rows. If the table has two rows, then the corresponding band fields must be in the second row. The first row should contain the marker with the corresponding band name and, if necessary, static text or other band fields.
Below is an example of a template which outputs a report consisting of two bands, Book and Authors. The first band outputs a book name and genre, and the second outputs a list of authors of this book.
An HTML template is defined in an .html file (UTF-8 encoding without BOM). FreeMarker tags are used to place data (FreeMarker documentation is available at freemarker.org/docs).
The FreeMarker document model has the following structure:
Band {
      bands [ bandName : [ band, .. ], .. ]
      fields [ fieldName : fieldValue, .. ]
}
For example, you should use the following expression to access the name field in a row having index 0 of the band band:
Root.bands.band[0].fields.name
You may variables for convenience, e.g.:
<#assign headerRow = Root.bands.Header[0]>
<p>Date: ${headerRow.fields.reportDate}</p>
Below is an example of a template which outputs a report consisting of two bands, Book and Authors. The first band outputs a book name and genre, and the second outputs a list of authors of this book.
<!doctype html>
<html>
<head></head>
<body>
   <#assign book = Root.bands.Book[0] />
    <#assign authors = Root.bands.Authors />

    <p>Name: ${book.fields.name}</p>
    <p>Genre: ${book.fields.literatureType.name}</p>
    <table border="1" cellpadding="5" cellspacing="0" width="200">
        <thead>
            <tr>
                <td>First name</td>
                <td>Last name</td>
            </tr>
        </thead>
        <tbody>
        <#list authors as author>
            <tr>
                <td>${author.fields.firstName}</td>
                <td>${author.fields.lastName}</td>
            </tr>
        </#list>
        </tbody>
    </table>
</body>
</html>
Below is a more complex example. Let us assume we have the following bands structure:
Root {
    HeaderBand {
        query = return [[ "name" : "Column1" ],[ "name" : "Column2" ]]
    }
    Band1 {
        query = return [
            ["field1" : "Value 11", "field2" : "Value 12"],
            ["field1" : "Value 21" , "field2" : "Value 22"]
        ]
    }
    Band2 {
        query = return [[ "header" : "Header1" ], [ "header" : "Header2" ]]
        SubBand1 {
            query = return [["header" : 'SubHeader1'] , [ "header" : 'SubHeader2' ]]
        }
    }
}- Inserting a field:
<!doctype html>
<html>
    <head>
        <title> Simple template </title>
    </head>
    <body>
        <#assign Tree1 = Root.bands.Band2>
        <h1> Header </h1>
        <p>
            ${Tree1[1].bands.SubBand1[0].fields.header}
        </p>
    </body>
</html>- Inserting a list:
<!doctype html>
<html>
    <head>
        <title> List </title>
    </head>
    <body>
        <#assign Table1Header = Root.bands.HeaderBand>

        <#if Table1Header?has_content>
        <ol>
            <#list Table1Header as header>
            <li> ${header.fields.name} </li>
            </#list>
        </ol>
        </#if>
    </body>
</html>- Inserting a table:
<!doctype html>
<html>
    <head>
        <title> Table </title>
    </head>
    <body>
        <#assign Table1Header = Root.bands.HeaderBand>
        <#assign Table1 = Root.bands.Band1>
        <table border="1" cellpadding="5" cellspacing="0" width="200">
            <thead>
                <tr>
                <#list Table1Header as header>
                    <td> ${header.fields.name} </td>
                </#list>
                </tr>
            </thead>
            <tbody>
            <#list Table1 as row>
                <tr>
                    <td>
                        ${row.fields.field1}
                    </td>
                    <td>
                        ${row.fields.field2}
                    </td>
                </tr>
            </#list>
            </tbody>
        </table>
    </body>
</html>- Inserting a multi-level list:
<!doctype html>
<html>
    <head>
        <title> Multi-level list </title>
    </head>
    <body>
        <#assign Tree1 = Root.bands.Band2>
        <ul>
            <#list Tree1 as item>
            <li>
                <h2> ${item.fields.header} </h2>
                <#if item.bands.SubBand1?has_content>
                <ul>
                    <#list item.bands.SubBand1 as subitem>
                    <li>
                        <h3> ${subitem.fields.header} </h3>
                    </li>
                    </#list>
                </ul>
                </#if>
            </li>
            </#list>
        </ul>
    </body>
</html>
Reports which have a template in HTML format and the PDF output format do not always properly display fonts. To resolve this,
add cuba/fonts subdirectory with required .ttf fonts to the Middleware configuration directory (tomcat/conf/app-core in default deployment configuration). Additionally, you can use existing operating system fonts by specifying their path
in the cuba.reporting.fontsDir application property.
In order to resolve the fonts issue on a Ubuntu server, you should do the following:
-
Install the
ttf-mscorefonts-installerpackage:$ sudo apt-get install ttf-mscorefonts-installer
-
Set the cuba.reporting.fontsDir application property:
cuba.reporting.fontsDir = /usr/share/fonts/truetype/msttcorefonts
- Explicitly specify fonts in HTML templates, for example:
<html>
<head>
    <style type="text/css">
        * {
            font-family: Times New Roman;
        }
    </style>
Class-defined templates are used when it is too difficult or impossible to select data using SQL, JPQL or Groovy. They are used, for example, when the report is a result of combining several other reports.
The class defining the template must implement the com.haulmont.yarg.formatters.CustomReport interface. In the class, you need to define the createReport() method, which returns an array of bytes and takes the following input parameters:
report- report descriptor of thecom.haulmont.yarg.structure.Reporttype.rootBand- root band data of thecom.haulmont.yarg.structure.BandDatatype.params- map of external report parameters.
Below is an example of a simple class-defined template. It creates an HTML document showing the name of a book selected as report parameter:
package com.sample.library.report;

import com.haulmont.yarg.formatters.CustomReport;
import com.haulmont.yarg.structure.BandData;
import com.haulmont.yarg.structure.Report;
import com.sample.library.entity.Book;
import java.util.Map;

public class BookReport implements CustomReport {
    @Override
    public byte[] createReport(Report report, BandData rootBand, Map<String, Object> params) {
        Book book = (Book) params.get("book");
        String html = "<html><body>";
        html += "<p>Name: " + book.getName() + "</p>";
        html += "</body></html>";
        return html.getBytes();
    }
}
Chart output type is available if the application project depends on the charts base project. Resulting chart is displayed in the Reports → Show Charts screen of your web application.
Two types of diagrams are supported: Pie chart and Serial chart. Each type has its own set of parameters.
Pie chart:
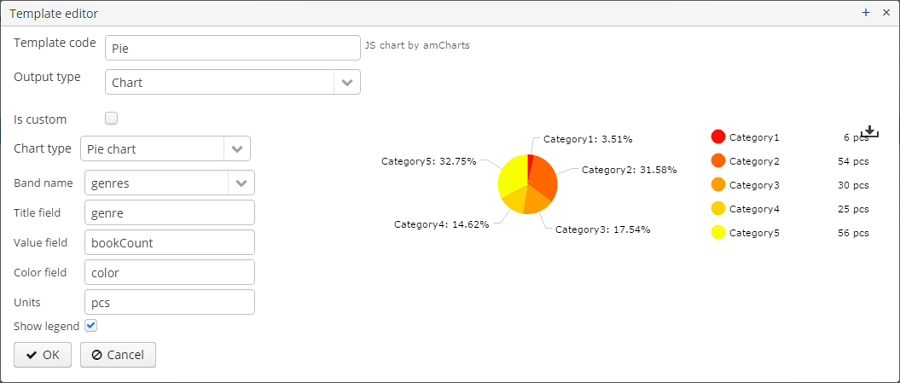
- Band name - a band providing data for the chart.
- Title field - a field from which segment names will be taken.
- Value field - a field from which segment values will be taken.
- Color field - a field from which segment colors will be taken. The color value should be specified in the web format. If not defined, colours will be chosen automatically.
- Units - this text will be added to legend values.
Serial chart:
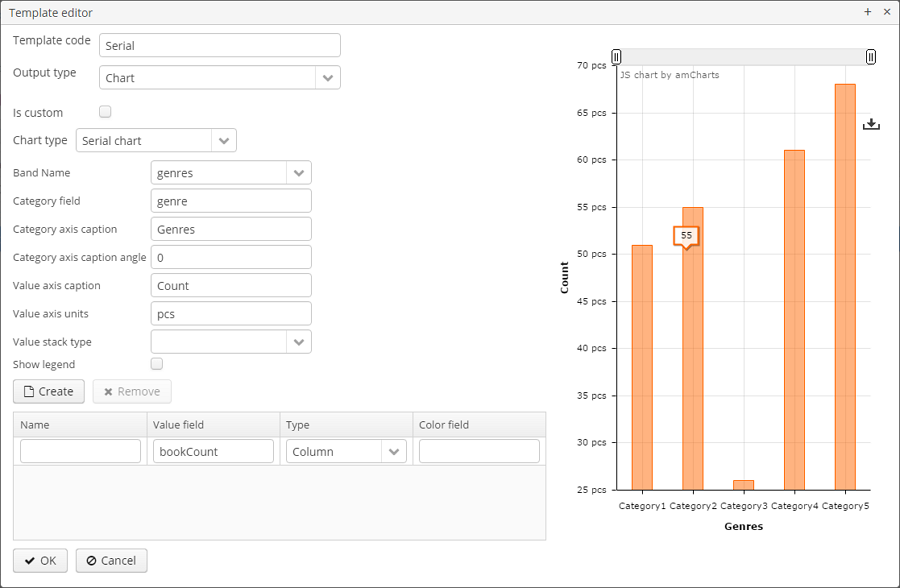
- Band name - a band providing data for the chart.
- Category field - a field from which category names will be taken.
- Category axis caption - a caption for the horizontal axis.
- Value axis caption - a caption for the vertical axis.
- Value axis units - this text will be added to values.
At least one row definition must be added for the serial chart:
- Value field - a field from which row values will be taken.
- Type - row display type.
- Color field - a field from which segment colors will be taken. The color value should be specified in the web format. If not defined, colours will be chosen automatically.
==== Output format compliance matrix
| Template / Output | XLSX | XLS | DOCX | DOC | ODT | HTML | Chart | |
|---|---|---|---|---|---|---|---|---|
|
XLSX |
+ |
+ 1 |
||||||
|
XLS |
+ |
+ 1 |
||||||
|
DOCX |
+ |
+ 2 |
+ |
|||||
|
DOC |
+ |
+ 1 |
||||||
|
ODT |
+ |
+ 1 |
||||||
|
HTML |
+ |
+ |
||||||
|
Chart |
+ |
1 - OpenOffice must be installed for output.
2 - depending on the cuba.reporting.openoffice.docx.useOfficeForPdfConversion application property, the output can be performed with or without OpenOffice. In the latter case, you need to provide required fonts, as described in Chapter 1, Creating Reports.
=== External Report Parameters
External parameters are passed from the outside when running a report and can be used as conditions in datasets. All external parameters become fields for each report band, so you can use them directly in the template as dataset fields. If any dataset contains field with the same name, it overrides the external parameter in the corresponding band and the report uses the dataset field value.
You can describe the external parameters in the Parameters and Formats tab of the report editor. The form for adding parameters is provided below:
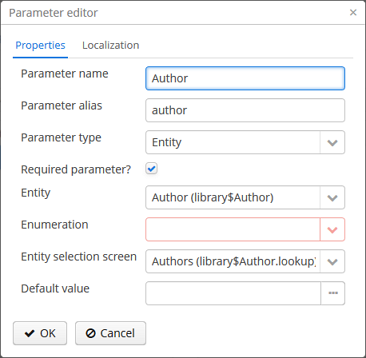
Properties tab:
- Parameter name - parameter name, as it will appear in the parameter input form when running the report.
- Parameter alias - parameter alias used to access it in datasets.
- Parameter type - parameter type.
- Required parameter - flag determining if the parameter is mandatory.
- Entity - if the Entity or List of entities of entities parameter type is selected, then you need to select the entity type in this field.
- Enumeration - if the Enumeration parameter type is specified, then you need to select the enumeration type in this field.
- Entity selection screen - optional screen identifier, which will be used to select entity instances. If the screen is not specified, selection will be made from a special screen generic for all entities.
In the Localization tab, you can define the parameter name for different locales. In order to do this, you should enter the locale_name = parameter_name pairs, for example:
ru = Книга
You can specify the formatting for any field output by the report in the Parameters and Formats tab of the report editor. Below is the form to add a format:
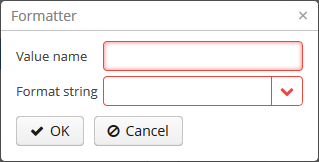
- Value name - report field name with the band prefix, for example
Book.name. - Format string - field format. For number values, you must specify the format according to the
java.text.DecimalFormatrules, for dates -java.text.SimpleDateFormat.
With the help of formats, it is possible to insert images and HTML blocks into the document.
- In order to insert an image, you must specify the image URL as the field value and the format string must be as follows:
${image:<Width>x<Height>}, for example${image:200x300}. - In order to insert an HTML block, you should return an HTML markup in the field, and select
${html}as the format string. In the output value, you may omit top-level tags up to<body>inclusive. If necessary, all missing top-level tags will be added automatically. All blocks should be encoded withUTF-8. CSS and thestyleattribute are not supported.
You can define user rights to access the report as well as report availability in certain application screens in the Roles and Screens tab of the report editor.
If the report roles list contains at least one role, the report will be available only to users with this role. If no roles are specified, the report is available to everyone.
The screens list allows to specify, which screens the report will be available in when invoking RunReportAction, TablePrintFormAction or EditorPrintFormAction actions. If no screen is specified, the report will be available from any screen.
You can localize the report name - show the name in the language, which the user is logged in with, in the report list. In
order to do this, you need to go to the Localization tab and enter pairs, locale_name = report_name, as separate lines in the text field, for example:
en = Books by author
ru = Книги по автору
