Open the Screens tab in CUBA Studio and create a screen in the web module. Enter the value com/sample/library/web/charts/statistics.xml in the Reference field. The fields - Id, Controller Name and Messages Pack will be filled in with appropriate values. Save changes. Open the XML tab and replace its content with the following code:
<?xml version="1.0" encoding="UTF-8" standalone="no"?>
<window xmlns="http://schemas.haulmont.com/cuba/window.xsd"
        caption="msg://statistic"
        class="com.sample.library.web.charts.statistics.Statistics"
        messagesPack="com.sample.library.web.charts.statistics"
        xmlns:chart="http://schemas.haulmont.com/charts/charts.xsd">
    <dsContext>
        <collectionDatasource id="pieDs"
                              class="com.sample.library.entity.BooksByGenre"
                              refreshMode="NEVER"
                              view="_local"/>
    </dsContext>
    <layout spacing="true">
        <tabSheet height="100%"
                  width="100%">
            <tab id="pieChartTab"
                 caption="msg://booksByGenres">
                <hbox expand="pieChart"
                      height="100%"
                      margin="true"
                      spacing="true"
                      width="100%">
                    <chart:pieChart id="pieChart"
                                    angle="30"
                                    balloonText="[[genre]] - [[percents]]%"
                                    datasource="pieDs"
                                    depth3D="15"
                                    height="100%"
                                    titleField="genre"
                                    valueField="countOfBooks"
                                    width="100%">
                        <chart:exportConfig menuTop="0px">
                            <chart:menuItems>
                                <chart:menu format="PNG"
                                            icon="VAADIN/resources/amcharts/images/export.png"/>
                            </chart:menuItems>
                        </chart:exportConfig>
                    </chart:pieChart>
                    <table columnControlVisible="false"
                           height="100%"
                           width="300px">
                        <columns>
                            <column id="genre"/>
                            <column id="countOfBooks"/>
                        </columns>
                        <rows datasource="pieDs"/>
                    </table>
                </hbox>
            </tab>
            <tab id="stackedChartTab"
                 caption="msg://countOfBooksByPublisherAndYear"
                 spacing="true">
                <chart:serialChart id="stackedChart"
                                   categoryField="year"
                                   height="100%"
                                   plotAreaFillAlphas="0.1"
                                   width="100%">
                    <chart:chartCursor/>
                    <chart:legend markerType="TRIANGLE_RIGHT"
                                  position="TOP"
                                  valueAlign="LEFT"/>
                    <chart:categoryAxis startOnAxis="true"
                                        title="msg://year"/>
                    <chart:valueAxes>
                        <chart:axis gridAlpha="0.07"
                                    position="LEFT"
                                    stackType="REGULAR"
                                    title="msg://countOfBooks"/>
                    </chart:valueAxes>
                    <chart:exportConfig menuTop="0px">
                        <chart:menuItems>
                            <chart:menu format="PNG"
                                        icon="VAADIN/resources/amcharts/images/export.png"/>
                        </chart:menuItems>
                    </chart:exportConfig>
                </chart:serialChart>
            </tab>
        </tabSheet>
    </layout>
</window>
The root element of the screen descriptor contains a new xmlns:chart attribute:
<window xmlns:chart="http://schemas.haulmont.com/charts/charts.xsd"
...
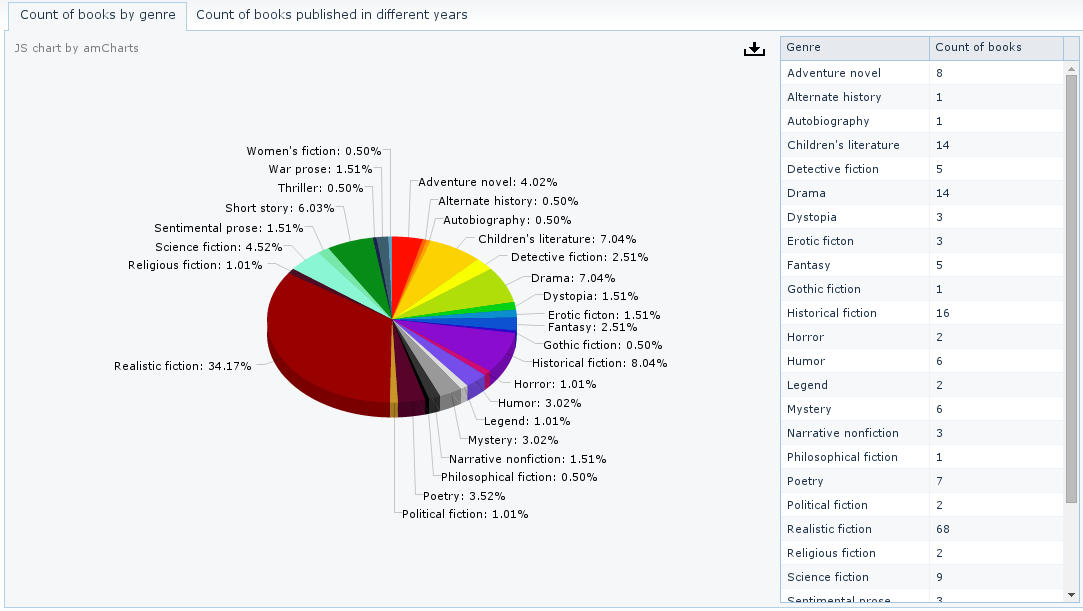
>The screen that we created contains a panel with two tabs. The first tab contains a pie chart showing the distribution of books by genre:
<chart:pieChart id="pieChart"
                    angle="30"
                    balloonText="[[genre]] - [[percents]]%"
                    datasource="pieDs"
                    depth3D="15"
                    height="100%"
                    titleField="genre"
                    valueField="countOfBooks"
                    width="100%">
        <chart:exportConfig menuTop="0px">
            <chart:menuItems>
                <chart:menu format="PNG"
                            icon="VAADIN/resources/amcharts/images/export.png"/>
            </chart:menuItems>
        </chart:exportConfig>
    </chart:pieChart>
The chart retrieves data from the pieDs datasource defined in the datasource attribute. Names and values are displayed using the genre and countOfBooks attributes of the BooksByGenre entity; the list of instances for this entity is stored in the datasource. The datasource is also connected to a table that
shows the same data as the chart.
The pieChart component contains the following attributes:
-
angle- defines the chart angle. May have a value from0to90. -
balloonText- defines text for the tooltip that appears when hovering over a pie slice. You can use the following tags:[[value]],[[title]],[[persents]],[[description]], as well as keys from theDataItemlisted in aDataProviderinstance, or names of the entity attributes from the datasource. -
depth3D- chart thickness. When used in combination with theangleattribute, helps to create a 3D effect. -
titleField- a key from the list of pairs contained in theDataItemobjects listed in aDataProviderinstance; this key is used to determine the name of a pie chart slice. -
valueField- a key from the list of pairs contained in theDataItemobjects listed in aDataProviderinstance; this key is used to determine the value of a pie chart slice.
The pieChart component contains the following elements:
-
chart:legend- defines chart legend. Thepositionattribute defines the location of the legend relative to the chart, andmarkerTypedefines the shape of the information marker for pie chart slices. -
chart:exportConfig– enables chart export. ThemenuTop,menuLeft,menuRightandmenuBottomattributes define the button location. In our example, the button is located in the top right corner of the chart.The
chart:menuItemselement contains export settings. In addition to thepngformat used in our example, the chart can also be exported asjpg,svgorpdf. Theiconattribute contains a path to an image that should be used as an icon for the export button.
The second tab contains a chart showing the number of books issued by several publishers in different years:
<chart:serialChart id="stackedChart"
                       categoryField="year"
                       height="100%"
                       width="100%">
       <chart:chartCursor/>
       <chart:legend markerType="TRIANGLE_RIGHT"
                     position="TOP"
                     valueAlign="LEFT"/>
       <chart:categoryAxis startOnAxis="true"
                           title="msg://year"/>
       <chart:valueAxes>
          <chart:axis position="LEFT"
                      stackType="REGULAR"
                      title="msg://countOfBooks"/>
       </chart:valueAxes>
       <chart:exportConfig menuTop="0px">
          <chart:menuItems>
             <chart:menu format="PNG"
                         icon="VAADIN/resources/amcharts/images/export.png"/>
          </chart:menuItems>
       </chart:exportConfig>
    </chart:serialChart>
This chart retrieves data through the DataProvider created in the controller (see below), so the datasource attribute is not defined.
chart:serialChart attributes:
-
categoryField- a key from the set of pairs contained in theDataItemobjects listed in aDataProviderinstance; this key is used to determine the labels for the category axis.
The elements of chart:serialChart:
-
chart:chartCursor- an optional element adding a cursor to the chart; the cursor follows the mouse pointer and shows a tooltip with the value of the corresponding point on a chart. -
chart:categoryAxis- an element that describes the category axis. SettingstartOnAxisto true causes drawing the chart right from the value axis. The default value for this attribute isfalse. In this case, there will be a small gap between the value axis and the chart. Thetitleattribute defines the title of the value axis. -
chart:valueAxes- an element that defines vertical value axes. In our case, only one vertical axis is used; the axis is described by thechart:axiselement. Thepositionattribute defines position of the value axis relative to the chart. SettingstackTypetoREGULARmakes the chart display a rolling value. Setting this attribute tononerefers to a non-rolling value.
Open the Controller tab and replace its content with the following code:
package com.sample.library.web.charts.statistics;

import com.haulmont.charts.gui.amcharts.model.Graph;
import com.haulmont.charts.gui.amcharts.model.GraphType;
import com.haulmont.charts.gui.amcharts.model.charts.SerialChart;
import com.haulmont.charts.gui.amcharts.model.data.ListDataProvider;
import com.haulmont.charts.gui.amcharts.model.data.MapDataItem;
import com.haulmont.charts.gui.components.charts.Chart;
import com.haulmont.cuba.gui.components.AbstractWindow;
import com.haulmont.cuba.gui.data.CollectionDatasource;
import com.sample.library.entity.BooksByGenre;
import com.sample.library.service.StatisticsService;

import javax.inject.Inject;
import java.util.List;
import java.util.Map;
import java.util.UUID;

public class Statistics extends AbstractWindow {

    @Inject
    private CollectionDatasource<BooksByGenre, UUID> pieDs;

    @Inject
    private Chart stackedChart;

    @Inject
    private StatisticsService statisticsService;

    public void init(Map<String, Object> param) {
        initPieChart();
        initStackedChart();
    }

    private void initPieChart() {
        pieDs.refresh();

        List<BooksByGenre> booksByGenreList = statisticsService.getCountOfBooksByGenre();
        for (BooksByGenre booksByGenre : booksByGenreList) {
            pieDs.includeItem(booksByGenre);
        }
    }

    private void initStackedChart() {
        List<String> allPublishers = statisticsService.getTopPublishers(5);
        Map<Integer, Map<String, Long>> structuredData = statisticsService.getCountOfBooksByPublisherAndYear();

        ListDataProvider dataProvider = new ListDataProvider();

        for (Map.Entry<Integer, Map<String, Long>> entry : structuredData.entrySet()) {
            MapDataItem mapDataItem = new MapDataItem().add("year", entry.getKey());

            for (String publisher : allPublishers) {
                if (entry.getValue().containsKey(publisher)) {
                    mapDataItem.add(publisher, entry.getValue().get(publisher));
                } else {
                    mapDataItem.add(publisher, 0);
                }
            }
            dataProvider.addItem(mapDataItem);
        }

        SerialChart stackedChartConfiguration = (SerialChart) stackedChart.getConfiguration();
        stackedChartConfiguration.setDataProvider(dataProvider);

        Graph[] graphs = new Graph[allPublishers.size()];
        int i = 0;
        for (String publisher : allPublishers) {
            Graph publisherGraph = new Graph();
            publisherGraph.setFillAlphas(0.6);
            publisherGraph.setLineAlpha(0.4);
            publisherGraph.setTitle(publisher);
            publisherGraph.setType(GraphType.LINE);
            publisherGraph.setValueField(publisher);
            publisherGraph.setBalloonText(publisher + " - [[year]] year: [[" + publisher + "]] books");

            graphs[i] = publisherGraph;
            i++;
        }
        stackedChartConfiguration.addGraphs(graphs);
    }
}
The initPieChart() method populates the pieDs datasource with the data retrieved from the service. The refresh() method initializes the datasource. This method should be invoked regardless of the refreshMode="NEVER" attribute declared in the XML-descriptor.
The initStackedChart(List<String> allPublishers) method submits data to the chart as a rolling value. This type of charts shows the ratio of separate parts to their total
value. The method accepts a list of publishers who have published the largest number of books available in the library. For
each publisher, a separate graph is rendered showing the number of books issued in different years. The graph corresponds
to an instance of the Graph class. Let’s have a look at different graph configuration options:
-
setFillAlphas(0.6)- defines fill opacity. -
setLineAlpha(0.4)- defines graph line width. Possible values are from0to1. -
setTitle(publisher)- defines the graph title. -
setType(GraphType.LINE)- defines data display style. -
setValueField(publisher)- a key from the list of pairs contained in theDataItemobjects listed in aDataProviderinstance; this key is used to determine graph values. -
setBaloonText(publisher + " - [[year]] year: [[" + publisher + "]] books")- defines tooltip content.
Below are the screenshots of the screen that we have just created. Add the screen to the menu, then rebuild the project using -> and log in to the system. Open the statistics screen.
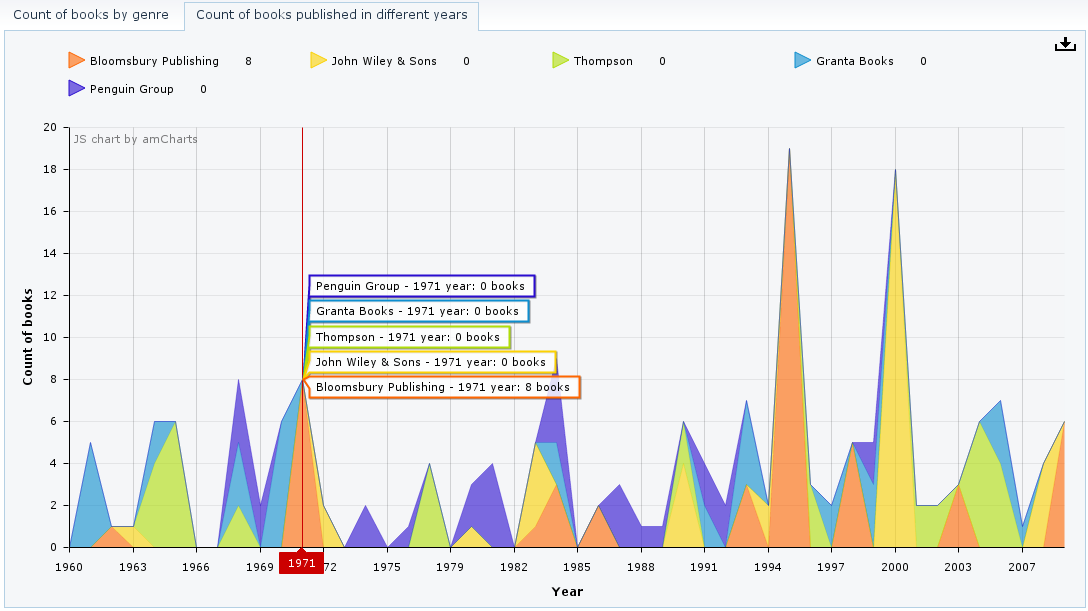
The rolling chart illustrates the cursor showing detailed information on the number of books issued by the publishers during the selected year.
